★ latest build
Grocery Retail Analytics
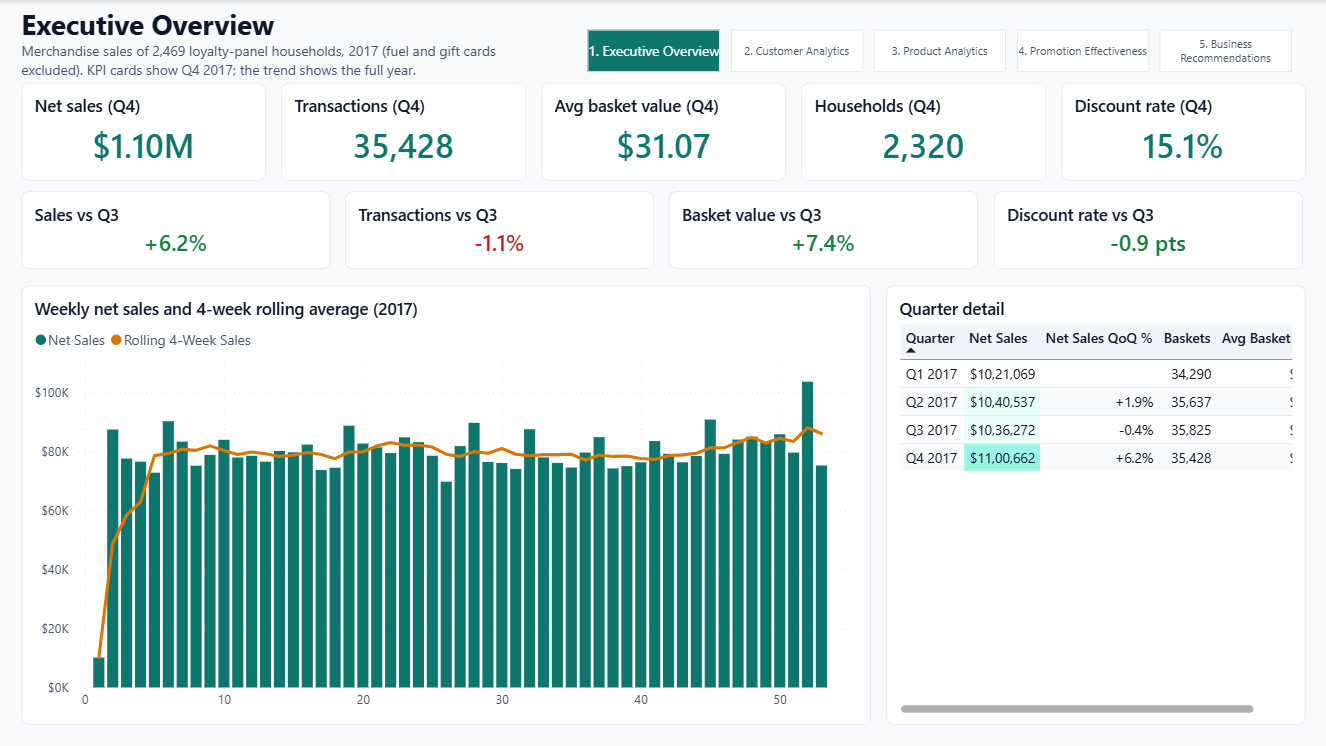
24-check data-quality gate → DuckDB star schema → 13 SQL analyses → difference-in-differences with placebo tests → 5-page Power BI report (44 DAX measures) + Streamlit app with a cite-or-refuse “ask the data” assistant.
1.46Mtransactions
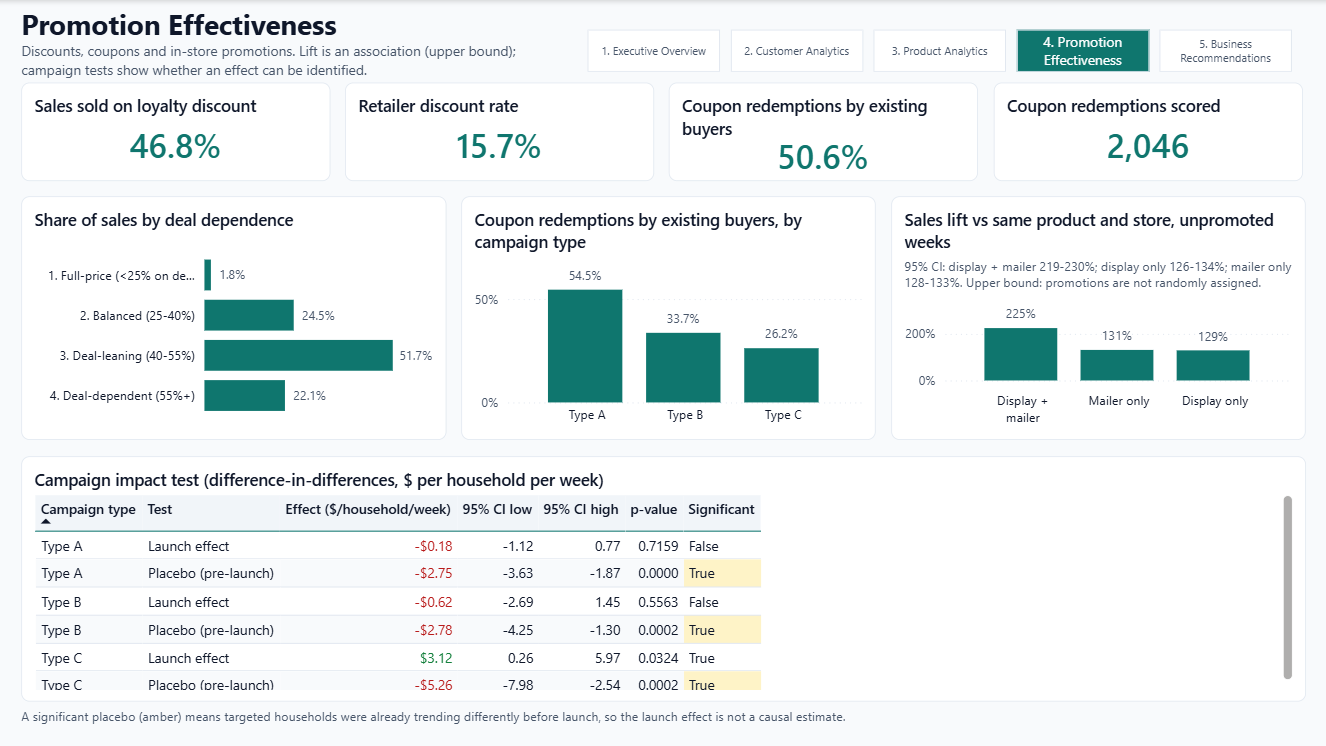
50.6%habitual coupons
225%display+mailer lift
58/58DAX = SQL
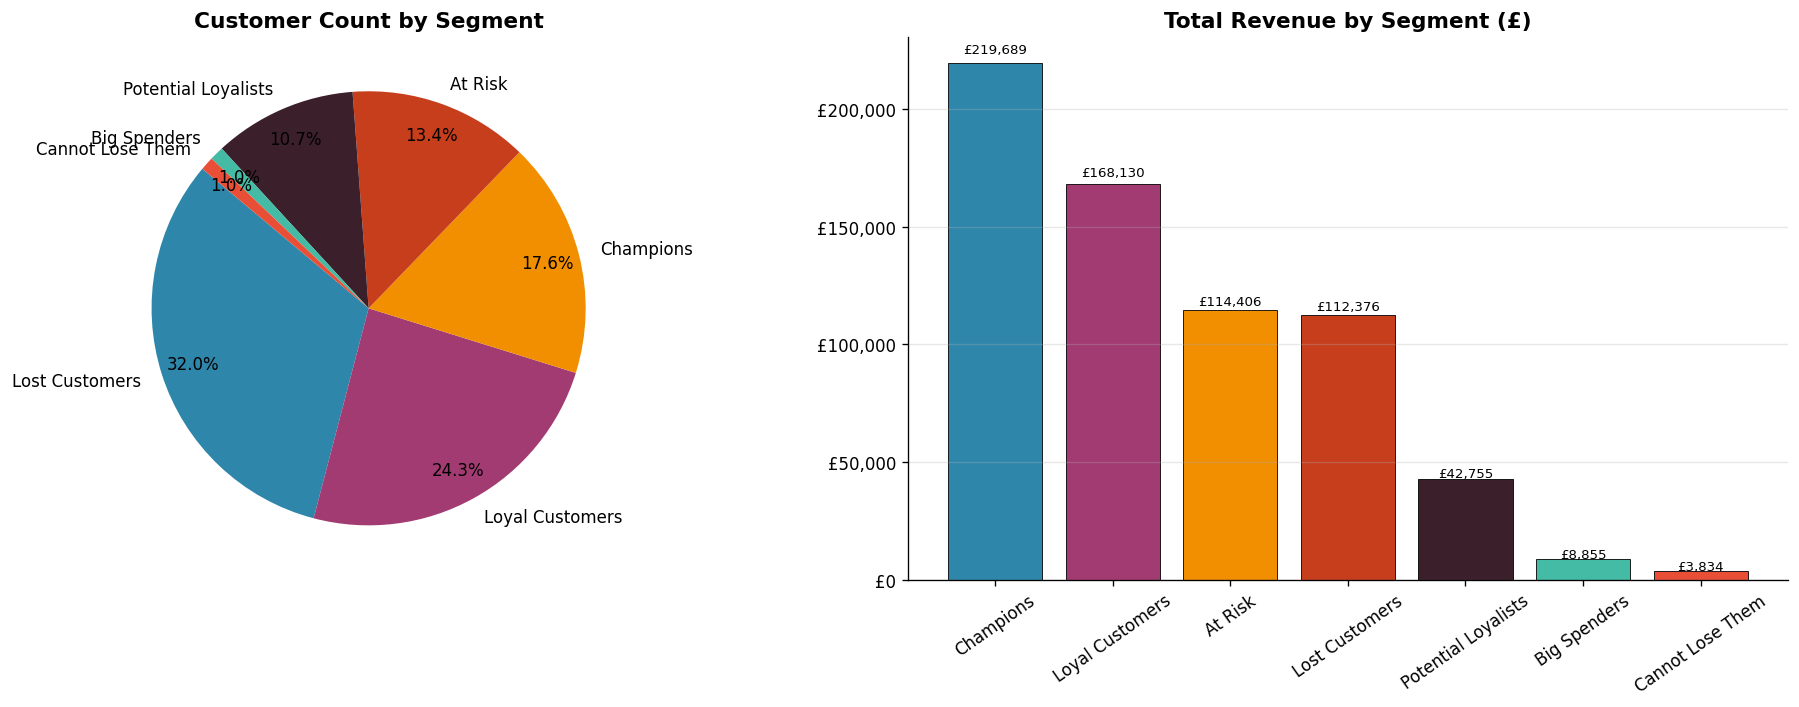
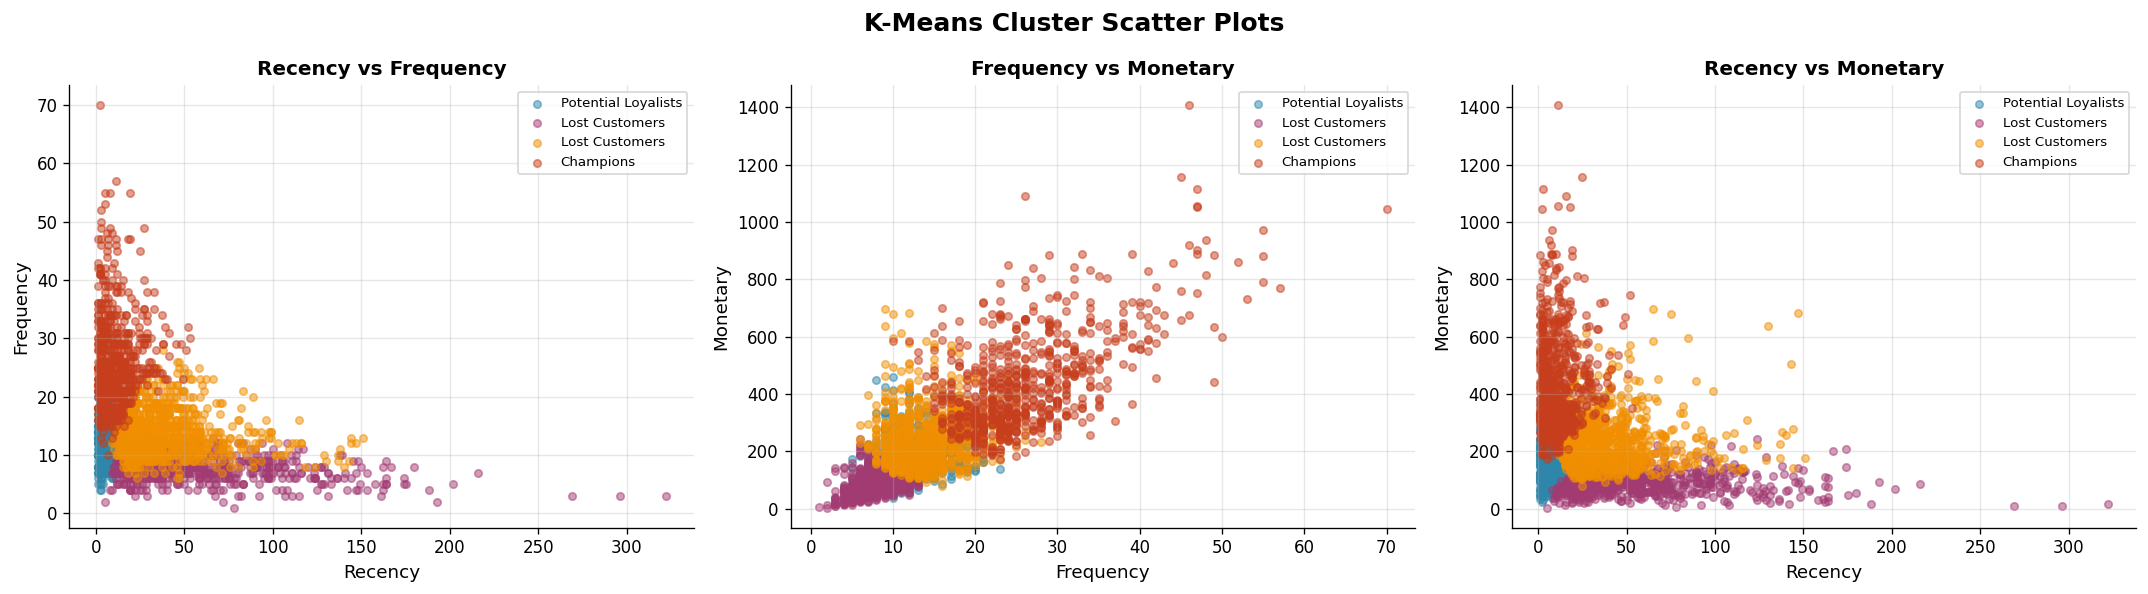
- Top 10% of households drive 34.2% of sales; 318 lapsing regulars hold 13.4%
- Placebo checks failed → campaign ROI unmeasurable; recommended a 10% random holdout
- SQL-vs-DAX reconciliation caught 3 DAX bugs before they reached the report
stack: python · duckdb sql · statsmodels · power bi · dax · streamlit · github actions